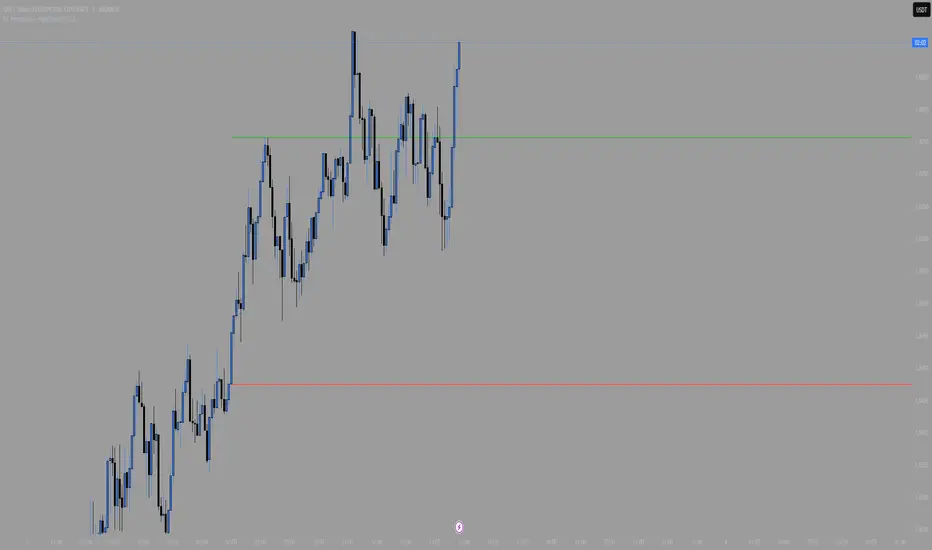
NY Premarket – High/LowNY Premarket – High/Low
Displays two horizontal lines for the last completed New York pre‑market session (07:00–09:30 America/New_York):
Premarket High (top wick of the session)
Premarket Low (bottom wick of the session)
Both lines are anchored to the exact candles that formed the session’s high/low and remain aligned with those candles regardless of zooming or panning.ng or panning.
Tìm kiếm tập lệnh với "high low"
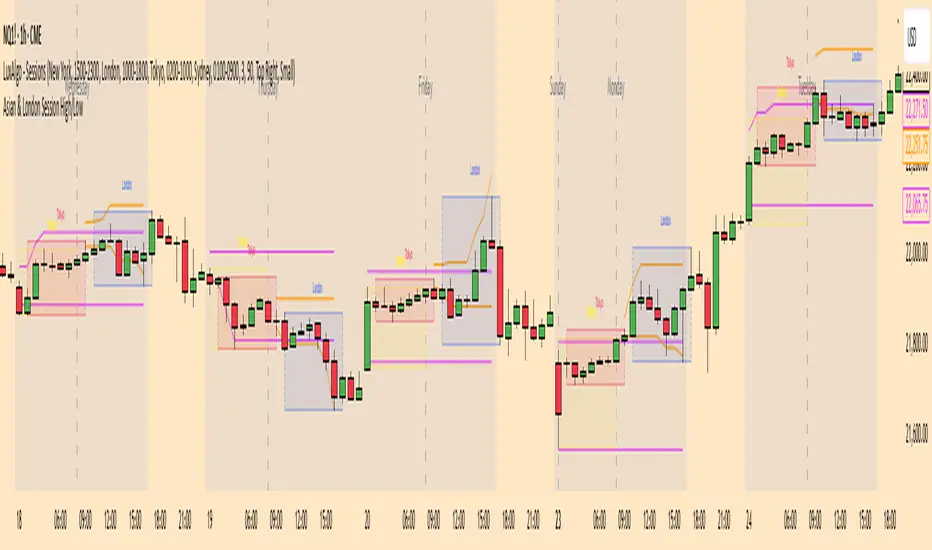
Asian & London Session High/LowThis Pine Script v6 indicator plots the high and low of the Asian and London trading sessions on the chart before the New York session opens.
Asian session is defined from 00:00 to 08:00 (Europe/Sofia time).
London session is defined from 09:00 to 16:30 (Europe/Sofia time).
The session highs and lows are tracked live and updated as new candles form within the session time ranges.
At 16:30, when the New York session opens, all high/low values are reset to na to prepare for the next day.
Horizontal lines are plotted using plot.style_linebr to extend the lines until the next candle.
This tool helps traders identify key support/resistance zones formed during the most active pre-New York hours.
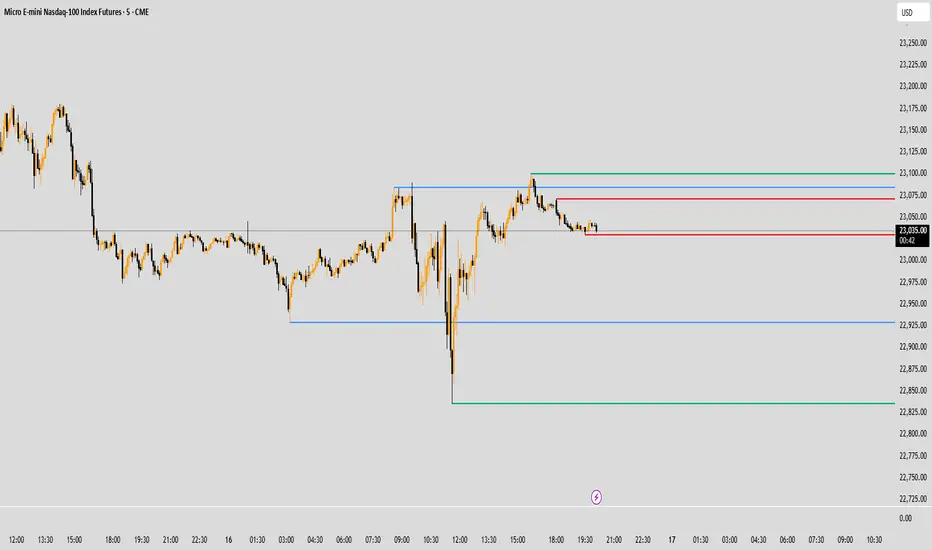
Trading session High/Low (Lumiere)Trading session High/Low
What it does:
Plots the High and Low for each session (Asia, London, New York) as horizontal zones that “snap” to the first true extreme of the session and then extend right.
Key points:
Snap‑to‑extreme only: Lines don’t draw at the open; they appear only once price makes a new session high or low, and anchor exactly at that bar.
Persistent until next session: Once drawn, each session’s lines stay on the chart after the session ends, and are cleared only when that same session next opens (or when you hide it).
Three configurable sessions:
Asia: 18:00–03:00 (UTC‑4)
London: 03:00–09:30 (UTC‑4)
New York: 09:30–16:00 (UTC‑4)
Customizable appearance:
You can toggle each session on/off, choose its color, and set line width.
The time that is already set on the different sessions is based on the standard session open/close. If you want to change it, it will refer to the NY time, UTC -4.
First 15-min Candle High/LowFirst 15-Min Candle High/Low – Intraday Range Indicator
This script plots the High and Low of the first 15-minute candle of the trading day using:
🟢 Green horizontal line for the first 15-min High
🔴 Red horizontal line for the first 15-min Low
These levels are commonly used by intraday traders as:
Breakout zones
Support/resistance levels
Entry/exit reference points
The script is designed to reset daily and is especially helpful for index and equity traders operating during market open volatility.
⏰ Optimized for markets operating in IST (Indian Standard Time), such as NSE/BSE, starting at 09:15 AM.
🛠️ How to Use:
Apply on 15-minute or lower timeframes
Ideal for breakout strategies, opening range setups, or volatility scalping

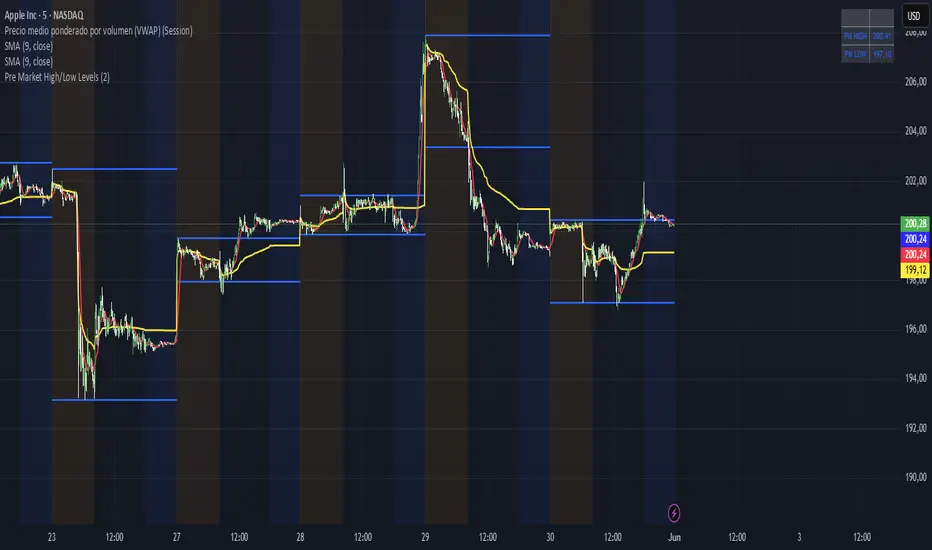
Pre Market High/Low LevelsPre Market High & Pre Market Low By Jadra
Pre Market High/Low Levels Indicator
This indicator automatically identifies pre-market high and low levels (4:00-9:30 AM ET) and marks them with blue horizontal lines that extend throughout the entire trading session. Perfect for NYSE and NASDAQ traders who use these key levels as support and resistance. Features color-coded backgrounds: yellow for pre-market, transparent for regular hours, and blue for post-market. Lines remain visible from pre-market through market close, providing constant visual references for making trading decisions based on these important psychological levels. Essential tool for day traders focusing on overnight price action and gap analysis in US equity markets.
Swing High/Low Scalper(Mastersinnifty)Overview
The Swing High/Low Scalper is designed for traders seeking structured entries and disciplined stop-loss planning during momentum shifts. It combines smoothed Force Index readings with swing high/low analysis to identify moments where both momentum and structural price levels align.
When a new directional bias is confirmed, the indicator plots clear entry signals and dynamically calculates the nearest logical stop-loss level based on recent swing points.
---
Core Logic
- Force Index Bias Detection
- The Force Index (price × volume change) is smoothed with an EMA to determine sustained bullish or bearish momentum.
- Signal Memory and Noise Reduction
- The indicator remembers the last signal (buy/sell) and only triggers a new signal when the bias changes, helping avoid redundant entries in sideways or noisy conditions.
- Swing-based Stop-Loss Calculation
- Upon signal confirmation, the script automatically plots a stop-loss label near the most recent swing low (for buys) or swing high (for sells).
- If conditions are extreme, fallback safety checks are used to validate the stop-loss placement.
---
Key Features
- Dynamic, structure-based stop-loss plots at every trade signal.
- Visual background bias:
- Green tint = Bullish bias
- Red tint = Bearish bias
- Minimalist and clean chart visualization for easy interpretation.
- Designed for scalability across timeframes (from 1-minutes to daily charts).
---
Why It’s Unique
- Unlike simple momentum oscillators or swing indicators, this tool integrates a state-tracking mechanism.
- A signal is only generated when a true shift in directional force occurs and swing structure supports the move, seeking to catch only meaningful changes rather than every minor fluctuation.
- This dual-filter approach emphasizes quality over quantity, aiming for disciplined entries with risk levels derived from actual price behavior, not arbitrary formulas.
---
How to Use
- Apply the Script to your desired chart and timeframe.
- Look for Signals:
- Green Up Arrow = Buy Signal
- Red Down Arrow = Sell Signal
- Observe Stop-Loss Labels
- Use the plotted SL labels for setting exit points based on recent swing structure.
- Monitor Background Bias:
- Green or Red background hints at prevailing directional momentum.
---
Important Disclaimer
This tool is intended to assist technical analysis and trade planning.
It does not provide financial advice or guarantee any future performance.
Always use additional risk management practices when trading.

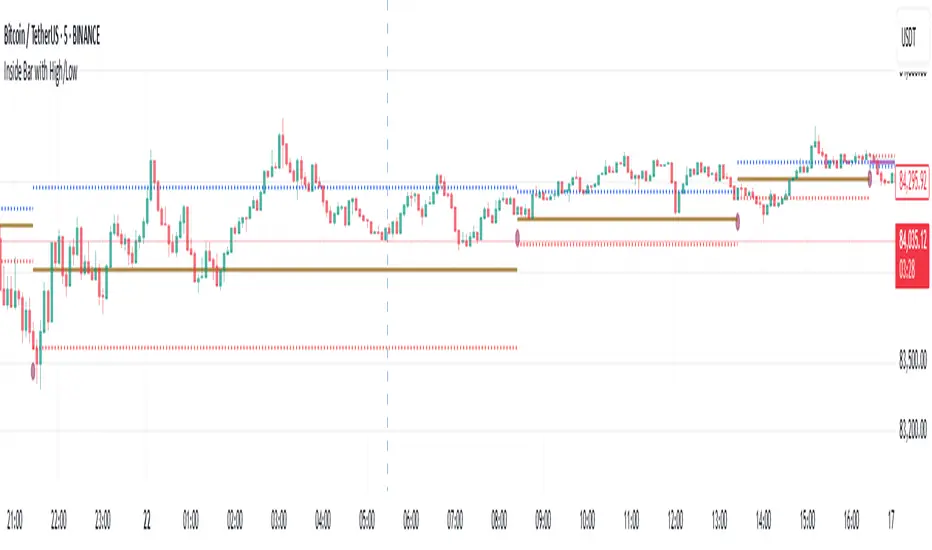
Inside Bar with High/LowInside Bar with High/Low
The indicator plots horizontal mid line between two Inside bars with High / Low with Multi Time Frame Selection by the user which can be traded in trending markets in the direction of the trend, when traded this way they are typically referred to as a ‘Breakout Play’ or an inside bar ‘Price Action Breakout Pattern’ They can also be traded counter-trend, typically from ‘Key Chart Levels’ , when traded this way they are often referred to as ‘Inside Bar Reversals’ .
The classic entry for an inside bar signal is to place a buy stop or sell stop at the high or low of the mother bar, and then when price breakouts above or below the mother bar, your entry order is filled with best time frame preferably more than 1 hour.
Stop loss placement is typically at the opposite end of the mother bar, or it can be placed near the mother bar halfway point (50% level), typically if the mother bar is larger than average.
It’s worth noting that these are the ‘classic’ or standard entry and stop loss placements for an inside bar setup is a useful tool for traders looking to identify potential reversals using the 20/50 EMA and candlestick patterns. However, like any trading tool, it should be used in conjunction with other indicators and analysis techniques for better accuracy
And also this tool is especially useful for day traders who want to track price action during specific times of the day and make informed decisions based on market behavior with more than 60 minutes period
As always, back testing and customization are recommended to optimize performance across different market conditions
In the end, experienced traders may decide on other entries or stop loss placements as they see fit.
Please remember that this indicator is provided for educational purposes only and does not constitute financial advice
JL - DWM OHLCThis indicator plots the following price levels on your chart automatically AND will not show up if you are using a timeframe bigger than 60 minutes, 1 day, or 1 week.
Here are the price levels that are automatically plotted for you, and so you know the styling is different for Daily, Weekly, Monthly levels so you can easily distinguish between them:
- Prior Day: High / Low / Close
- Current Day: Open
- Prior Week: High / Low / Close
- Current Week: Open
- Prior Month: High / Low / Close
- Current Month: Open
These plots are timeframe dependent and will not plot on subsequently higher timeframes, here is how they work:
Daily Price Levels are only shown on timeframes that are smaller than 60 minutes.
Weekly Price Levels are only shown on timeframes smaller than 1 Day.
Monthly Price Levels are only shown on timeframes smaller than 1 Week.
This way, you can turn on the indicator and not have to think about turning off certain price levels if you switch to a larger / longer timeframe than what you typically use.
For example, Daily OHLC price levels will quickly clutter the 60 minute chart, and likely you don't need to know the HLC of the Prior Day if you are looking at the 60 minute chart. Therefor it may be helpful to automatically hide the Daily price level plots, and only show the Weekly and Monthly plots on the 60 minute timeframe.
I hope you find this indicator helpful, thanks for reading.

[volfgang] Pivot Levels (Open, Close, High, Low)This script provides a clear and consistent way to track key price levels from Weekly and Daily bars, directly on your current chart interval.
The default colours are;
Today & This Week Open = White
Yesterday & Previous Week Open = Cream
Yesterday's High = Red
Yesterday's Low = Green
Weekly Pivots are 2px, and Daily Pivots are 1px.
Instead of requiring manual referencing of daily or weekly charts, these significant levels are automatically drawn and updated in real time, extending to the right as new bars form.
It adds value by helping traders quickly identify potential support/resistance zones and compare intraday price action with higher-timeframe pivots. This approach can aid in scalping, day trading, or swing trading strategies that rely on past price levels for trade entries, exits, or stop loss placement.
Daily Pivots Displayed Intraday
The script imports the previous day’s High, Low, Open, and Close and draws lines on the current chart, so you can see exactly where those levels lie on any intraday timeframe. You can easily change the colour of these lines in the menu.
Instead of switching between multiple charts for daily references, you can keep an intraday chart open and still watch how price behaves around these important daily pivots.
Weekly Pivots for Broader Context
In addition to daily levels, it also shows the previous week’s Open and Close. This feature helps traders who want to maintain a broader perspective and gauge the market’s weekly trend or bias while remaining on lower timeframes.
Automatic Line & Label Management
Each new trading day triggers a “session change” in the code, prompting the script to delete old lines and labels for daily levels. This keeps your chart from getting cluttered with outdated lines.
Weekly lines and labels follow the same approach, ensuring only the most recent weekly levels are highlighted.
Real-Time Extension
Lines are continuously extended to the right as new bars print, ensuring that you always have an updated view of your key price levels without any manual adjustments.
On the last bar, the script shifts to a time-based coordinate system for seamless visual extension.
Minimal Recalculation
This script uses security() calls in a carefully optimized way to reduce unnecessary recalculations and avoid repaint issues. By referencing open , close , etc., the lines remain fixed once the daily (or weekly) candle is confirmed.
Flexible Usage
You can apply this script to any symbol on TradingView. It’s especially beneficial for Forex pairs, indices, futures, or cryptocurrencies where you want to track significant past levels.
If you’re a scalper looking for areas of likely reaction, or a swing trader watching weekly opens for trend confirmation, these levels can be integral to your technical approach.
How to Use
Add to Chart: Click the “Add to Favorite Indicators” or “Apply to Chart” button once published.
Enable or Disable Previous Day Bars: Use the script’s input to toggle the display of previous day’s High, Low, Open, and Close lines if you only want weekly lines (or vice versa).
Customize Visuals: You can change line colors, width, and label text in the “Style” or “Inputs” tab. Adjust them to fit your preferred color scheme.
Interpretation:
Daily levels typically carry relevance for the next trading session. They can be used for intraday support/resistance, breakout checks, or gap fills.
Weekly levels help identify more prominent zones for bigger moves or for understanding overall sentiment from the prior week.
Conceptual Underpinnings
Support/Resistance: Past opens/closes often act as support or resistance because they represent important points of reference (where trading started or ended during a prior session).
Market Psychology: Many traders watch daily or weekly closes to gauge momentum and bias, which can become self-fulfilling as more participants join around those levels.
Improved Situational Awareness: By having these levels automatically drawn and updated, traders avoid missing critical areas where price may pivot.
This script is intentionally open-source to help traders study and personalize it.
By merging daily and weekly pivot concepts in a single script, it provides a convenient and efficient tool—rather than a simple mashup, it unifies two timeframes that are crucial in short-term and medium-term trading decisions.
Remember that these levels alone do not constitute a complete trading system; they are best used as part of a broader strategy involving risk management, additional technical signals, and market context.

Average High-Low Multi Time Frame Lines SunilTitle: Multi-Timeframe Average High-Low Levels with Custom Timeframes
Description:
This indicator calculates the average of high and low prices across up to four customizable timeframes. By default, it includes 30 minutes, 1 hour, 3 hours, and 1 day, but you can modify these directly in the input settings to suit your trading strategy.
Features:
Plots average high-low levels for selected timeframes with distinct colors.
Highlights buy zones (green) when the price is above all levels and sell zones (red) when the price is below all levels.
Marks areas where all levels align with a subtle blue background.
Use this tool to identify key levels and potential trading opportunities across multiple timeframes at a glance!

Higher Timeframe Open High Low ClosePURPOSE
1. Multi-timeframe analysis (MTFA).
2. Better visualize intraday price action relative higher timeframe price action, and this is not limited to the current time frame or the higher time frame including current price movement.
3. Higher Timeframes provides an overview of the long-term trend (e.g., weekly or monthly charts).
4. Confirm trends occurring on more than one timeframe.
5. Improve choice of entry and exit points.
ORIGINALITY
1. Compare current lower time frame price movement to current or previous higher time frame movement. The user specifies in the settings the higher time frame (day, week, month, quarter, or year) and the associated price movement data, including OHLC, average prices, and moving average levels.
2. Previous time frames and all specified levels (OHLC, average prices, and moving averages) can be shifted together to overlay the current time frame. This allows analysis of lower/intraday price movement against that of any past higher time frames.
3. Use: In the settings, the current time frame (i.e., that including current price movement) 'count from current' is '0', a count of '1' would shift one higher level time frame such that the open date of that shifted time frame aligns with the open date of the current time frame. A count of '3' would shift three higher level time frames to align with the current."
4. Example: On the Wednesday July 24 intraday chart, overlay the daily OHLC, typical price, and 10-day EMA data occurring at the close of Wednesday July 17. This allows analyze current price movement against data from one week prior.
HIGHER TIMEFRAME DATA that can be PLOTTED and SHIFTED
1. Open, High, Low, Close.
2. Average prices: Median (HL/2), Typical (HLC/3), (Average OHLC/4), Body Median (OC/2), Weighted Close (HL2C/4), Biased 01 (HC/2 if Close > Open, else LC/2), Biased 02 (High if Close > HL/2, else Low), Biased 03 (High if Close > Open, else Low).
3. Moving averages with user specified source, length and type.

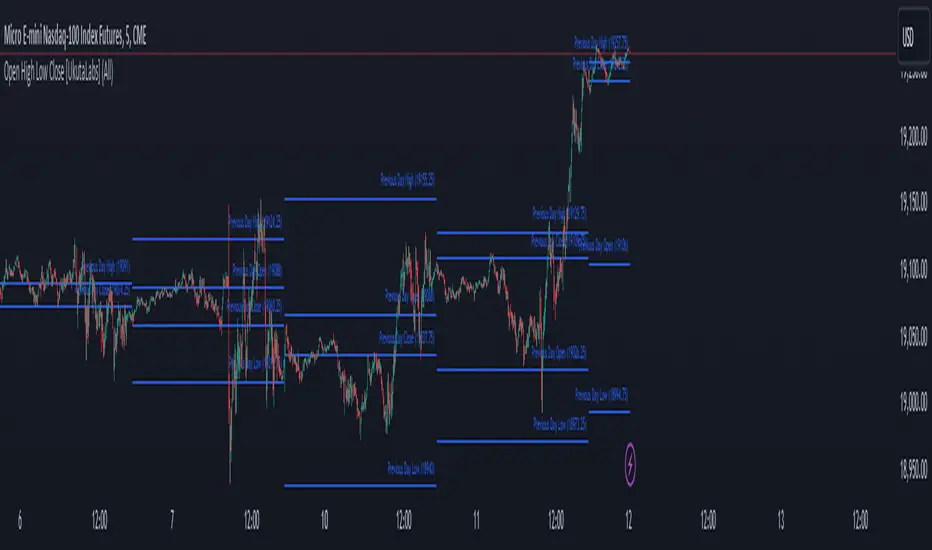
Open High Low Close [UkutaLabs]█ OVERVIEW
The Open High Low Close indicator is a powerful trading tool which generates resistance and support levels based on the previous day’s Open, High, Low and Close prices. These levels may act as strong levels of support and resistance, granting traders insight into key price levels.
The aim of this script is to simplify the trading experience of users by automatically identifying and displaying price levels that they should be aware of.
█ USAGE
At the beginning of each trading day, the script will automatically identify the previous day’s high, low, open and close prices. After identifying these levels, the script will then display them as a line on the chart.
Each line also has a label at the end indicating which level it represents. These labels can be toggled in the indicator's settings.
These levels are based on relevant price-action information and may serve as potentially powerful Support and Resistance levels that can be included in a variety of trading strategies.
█ SETTINGS
Configuration
• Show Labels: Determines whether or not identification labels are drawn on each line.
• Display Mode: Determines the number of days the script should load.
• OHLC Color: Determines the color of the lines and labels.
Previous and Premarket High/Low IndicatorDescription:
The "Previous and Premarket High/Low" indicator is designed to help traders identify key levels during the premarket, postmarket, and regular trading sessions. It highlights the highest and lowest prices during the premarket session and the previous trading day, providing critical levels for intraday trading strategies.
Features:
Customizable Display Settings: Users can adjust the colors, line styles, and line widths for the premarket and previous day high/low levels.
Session Labels: Clear labels indicating premarket and postmarket sessions for easy identification.
Alerts: Set alerts for significant price movements, such as new highs or lows during premarket and previous trading sessions.

Zigzag Chart Points█ OVERVIEW
This indicator displays zigzag based on high and low using latest pine script version 5 , chart.point which using time, index and price as parameters.
Pretty much a strip down using latest pine script function, without any use of library .
This allow pine script user to have an idea of simplified and cleaner code for zigzag.
█ CREDITS
LonesomeTheBlue
█ FEATURES
1. Label can be show / hide including text can be resized.
2. Hover to label, can see tooltip will show price and time.
3. Tooltip will show date and time for hourly timeframe and below while show date only for day timeframe and above.
█ NOTES
1. I admit that chart.point just made the code much more cleaner and save more time. I previously using user-defined type(UDT) which quite hassle.
2. I have no plan to extend this indicator or include alert just I thinking to explore log.error() and runtime.error() , which I may probably release in other publications.
█ HOW TO USE'
Pretty much similar inside mentioned references, which previously I created.
█ REFERENCES
1. Zigzag Array Experimental
2. Simple Zigzag UDT
3. Zig Zag Ratio Simplified
4. Cyclic RSI High Low With Noise Filter
5. Auto AB=CD 1 to 1 Ratio Experimental

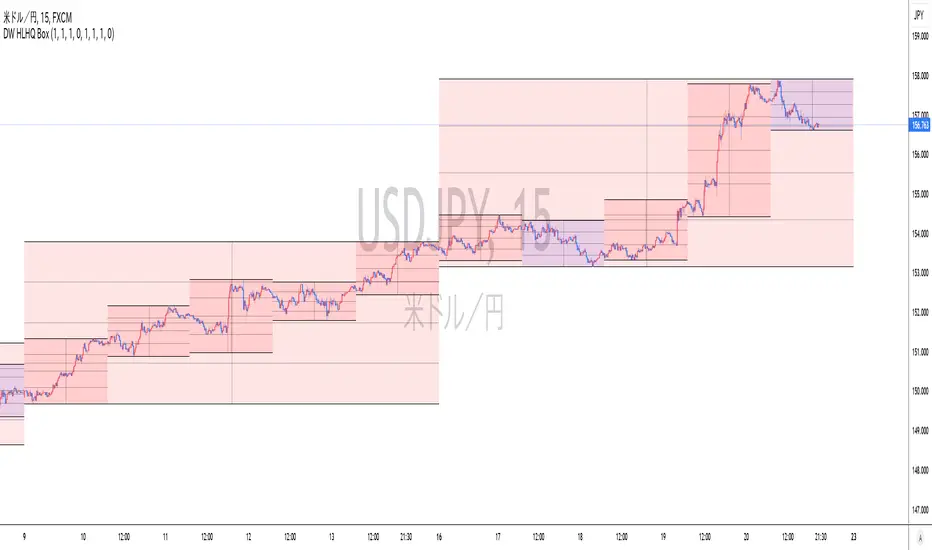
Realtime Daily High Low Half Quarter BoxOverview
This indicator offers real-time updates for daily high and low prices, addressing the issue of expanding plots in traditional daily high-low indicators.
It plots daily high, low, 1/2, and 1/4 price levels as horizontal lines.
It adds a vertical line at the center of the daily candle.
You can customize the indicator's background color for bullish and bearish days.
It extends horizontal lines until the daily candle switches.
This indicator is not compatible with second-by-second data.
Due to Pine Script's object drawing limitations, there is a restriction on how many days back the price lines can be drawn.
概要
このインジケーターは、従来の日足の高値・安値プロットの問題を解決し、リアルタイムでの更新を提供します。これにより、プロットが広がっていく現象が回避されます。
インジケーターは、日足の高値、安値、1/2、1/4の価格レベルを水平線で表示します。
一日の中央の時間に垂直線を追加します。
日足が陽線と陰線のいずれかに応じて、背景色をカスタマイズできます。
インジケーターは日足が切り替わるバーまで水平線を延長します。
このインジケーターは秒足データには対応していません。
Pine Scriptのオブジェクト描画数の制限により、価格ラインの描画が遡れる日数に制限があります。
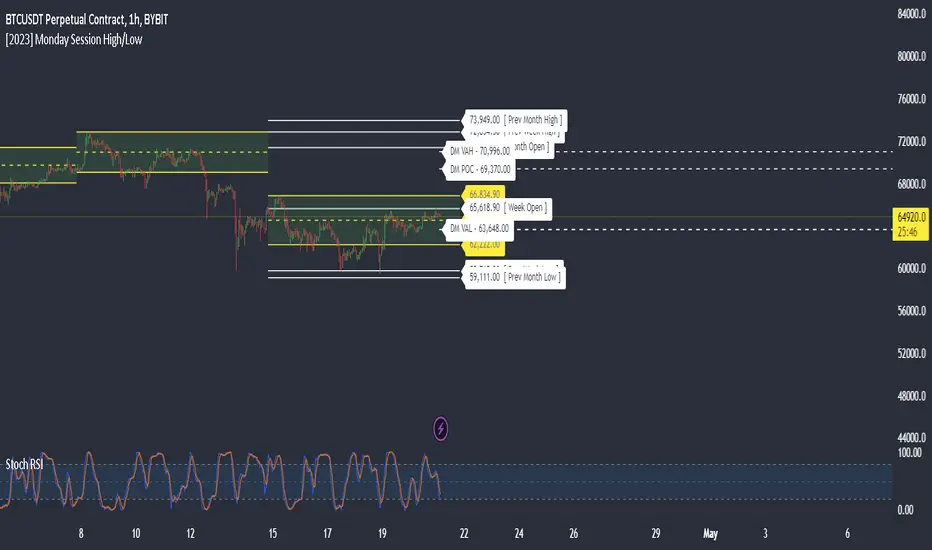
Monday Session High/LowThis script tracks and draw the High and the Low for Monday session across the whole week period.
Many crypto traders use the high and low extremes for Monday session as an confluence on how the price action during the week reacts against it.
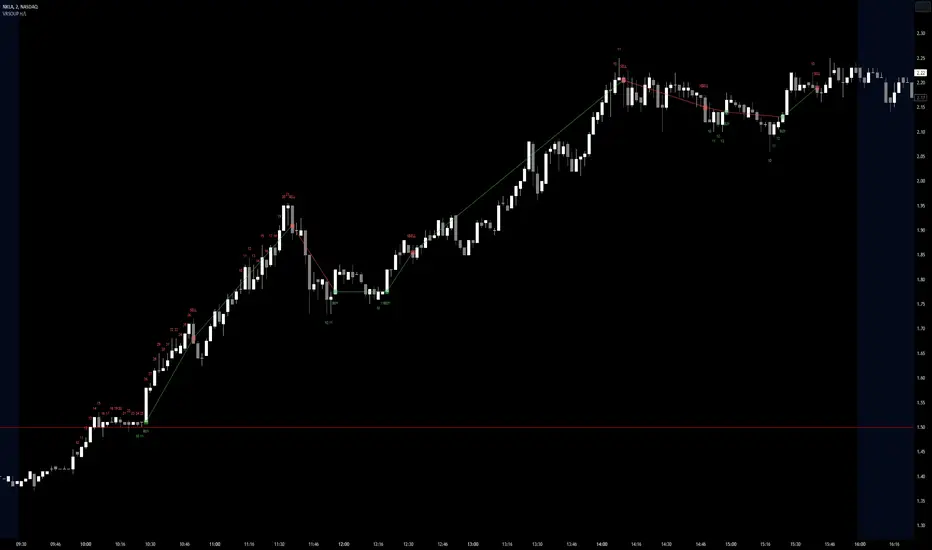
Visible Range Streaks of Unbroken Prior Highs/Lows [vnhilton](OVERVIEW)
This indicator keeps track of the number of unbroken prior highs/lows (unbroken being no price closes above/below the prior high/low). Great for entries and take profits. The indicator calculates on visible bars for convenience when looking back into the history without having to use bar replay, which those on the TradingView free plan cannot use intraday bar replay, so the visible range is a perfect work-around. The 2 minute chart above shows NASDAQ:NKLA on Thursday 13th July, 2023, with a significant level of $1.5 leading to a breakout. Streaks lower than 10 were hidden in the chart.
(FEATURES)
- Custom minimum streak size to start displaying plots (the smaller the size the more signals)
- Ability to show/hide numbers (that keep count of unbroken streaks), text signals (for when a streak is broken), break shapes (where the prior high/low was broken), and Zig Zag (lines between break shapes)
- Customisable Zig Zag line width, style, and colours (1 colour for a positive gradient line, and another for a negative gradient line)
- Customisable text signal text
- Customisable numbers, text signal, break shape, number label & text signal label colours
- Customisable number label, text signal label and break shape styles and sizes (number and text signal label share the same size)
Pivot Points High Low & Missed Reversal Levels [LuxAlgo]Pivot Points High/Low, sometimes referred to as "Bar Count Reversals" allows highlighting market prices local tops and bottoms. This method compares the price value at a certain index within a user-specified window length and tests whether it is the highest (pivot high) or lowest (pivot low).
This method can return successive pivots of the same type, thus missing certain reversals, as such, we aimed to highlight those missed reversals and provide a level at their location to determine if they had any significant role to play. A zig-zag is additionally built, connecting regular pivots with missed reversals.
Settings
Pivot Length: Determine the "Bar Count Reversals" window size. higher values will highlight more significant reversals.
Other settings control the look of the displayed graphical elements within the indicator.
Usage
Missed reversals are highlighted by labels with a ghost emoji, a Zig-Zag line connecting a missed reversal is dashed. Note that labels are offset by -Pivot Length bars (with the exception of the most recent one), and as such are detected further ahead of their location.
When a missed reversal is detected, a level is displayed, starting at the location of the missed reversal and ending when a new missed reversal is detected.
These levels can be used as support and resistance.
The most recent label estimates the possible location of a confirmed reversal, and will continuously readjust whether price makes a new higher high/lower low depending on the type of previously detected pivot. A level is also made out of this estimated reversal.

Sessions with High/Low DiffThe main purpose of this indicator is to facilitate backtesting, but it may also be useful for traders to easily identify the current
active/open trading sessions on lower-timeframe charts.
This indicator also tracks the session high/low difference and plots it as a label on the last candle of the session once the last
bar of that session has finished printing and a new candle opened. The position and direction of the label is based on the
session open and close - if the session open is greater than the session close (which would equate to the equivalent of a red candle),
the label will be printed UNDER the last candle, and vice versa if the session close is above the session open.
The number printed inside the label is the difference between the session high and the session low, scaled to the minimum tick value of the chart.
Note #1: There is a Pinescript maximum of 500 labels allowed on any chart. While I could have gotten fancy and done some wizardry with label arrays,
I didn't really see a point to it. If labels are enabled for all 4 sessions at the same time, that would still have them available for the past 125
sessions, which would be about 6 months (approx 252 trading days per year, and this would cover 125 of them). If you limit to 2 sessions, you double
your potential look-back to almost a year (250 days out of the 252 average trading days each year), and for a single session, you double it yet again
to just under 2 years.
Note #2: As this indicator tracks open, high, low, and close for each session, it can potentially be enhanced (or forked) to construct "session candles".
I'm not sure what use this would be to anyone, but the pieces are there should someone find a use for it.
While it would be easy to add alerts on sessions opening/closing, I didn't see a purpose or value in that as it would be little more than a
glorified alarm clock. If I get enough demand to add them, I will gladly consider it.

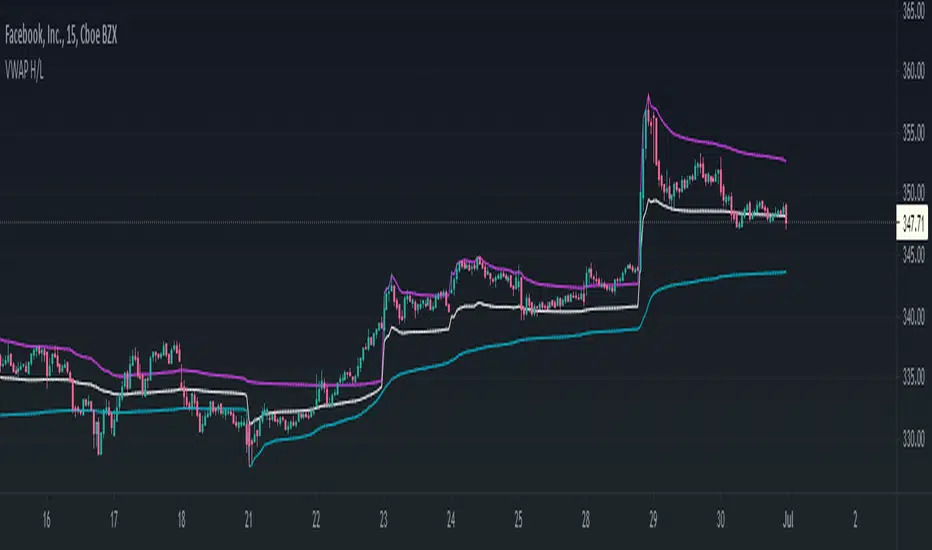
VWAP High/Low ChannelIn short, the VWAP High/Low Channel is based on VWAP "newsession" on swing high/low, with a basis of the two.
The VWAP High/Low channel seems to act like Bollinger bands or Donchain Channels when squeezing for a breakout, while also acting as a pivot after a breakout.
ALL TIME HIGH/LOW AND 52 WEEKS HIGH/LOWThis script show:
1. All time high/low line shown in maroon color
2. 52weeks high/low line shown in red color
3. 25% below 52wh and 30% upper 52wl as per Mark Minervini suggset in his book "Trade Like a Stock Market Wizard: How to Achieve Super Performance in Stocks in Any
Market"
Thats all, hope benefit tou you all.
Thank you.

Cumulative High Low IndexThis indicator tells how many days it is making new HighLowPeriod highs or lows in Lookback period.
If bar makes new HighLowPeriod high, HighLow index for that bar is +1
If bar makes new HighLowPeriod low, HighLow index for that bar is -1
Cumulative high low index is sum of HighLow index for Lookback periods.
Optional moving average can also be applied on this index

X Period High/Low/MidToday we have a simple, but endlessly versatile, indicator that plots the X Period High/Low/Mid of your chosen market.
Traditionally the 52 week High/Low is used as a breakout signal. However, by changing to an X period, and adding a midway line, we create a more versatile indicator that can be tailored to various markets.
By default it's set at 250 periods (because I like the 250 period moving average), and I generally trade H4 and Daily time frames. But tweak it to your liking, you just have to modify the length periods by your desired time frame and lookback length. E.g. to create a 52 week indicator on the daily time frame, enter a length of 260 in the indicator (5 days per week * 52 weeks = 260).
For the above reason, I haven't made this indicator MTF, as there's no real need. However, if users find it easier I can look at adding it later.
Also, the mid point between an X period high/low is often a good trend-follower, as well as acting as support/resistance . I encourage you to experiment with different ways of using this indicator. Entire systems (if your risk management is correct) can be built and traded from this one indicator.
Good luck.
DD
